Tucking your store in for the New Year


Congratulations, you've survived peak and you and your team can finally go home and relax with your family; but there's just a few things to do first.
More often than not, most stores run a skeleton staff between 25th Dec and 4th Jan - and perhaps you are one of those. The downside to this is that you don't quite have the visibility that you normally would have over bugs/errors with your store - and if an issue occurs, it may not be noticed for several hours.
I'm not looking to provide a definitive guide on capturing/preventing errors, but instead, just focus on the simple, avoidable issues that can have a dramatic effect on sales performance.
Don't neglect your server
We're here for you, and if you've got Fully Managed/Enhanced support (or higher), we'll be pro-actively monitoring your server utilisation and nipping errors in the bud before they get a chance to develop - but if not, then you'll need to ensure you are checking on these.
Server notifications
With MageStack, you can subscribe to receive the server notifications for RAM/CPU/Disk thresholds being hit. All you need to do is submit a support ticket and provide the email address(es) you want to receive the notifications and we'll enable it for you.
This will allow you to be pro actively informed of limits being reached/hit and take action.
Disk utilisation
Increase in disk usage can occur for a few reasons; from growing log files to growing data in the database, to the Magento core_url_rewrite bug. Keeping on top of disk utilisation will prevent unwanted downtime and there's a fantastic article that covers this.
Read more about maintaining healthy disk utilisation
The two main areas to monitor are
- Domains
- MySQL
Where usage above 50% is a concern, above 80% utilisation risks downtime and over 90% utilisation risk data loss. The other partitions (backups, logs, root, config etc.) are system partitions for MageStack and are self-monitoring.
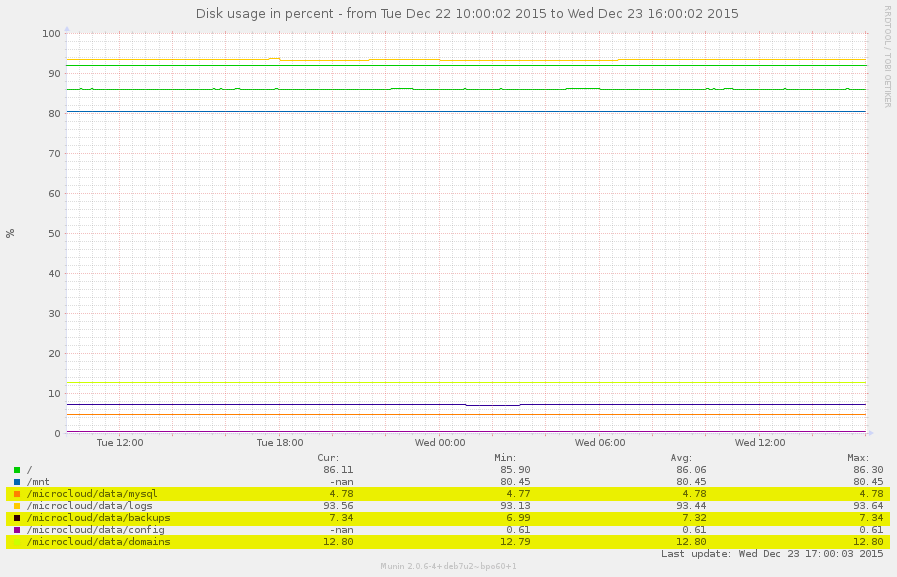
Munin
The disk utilisation graphs on Munin show current usage and historical trends, its a great way to check on growth and usage. Specifically, you want to check the data from the dh (physical) server(s) in your stack.
Eg. https://munin.magestack.com/i/dh1.i/df.html
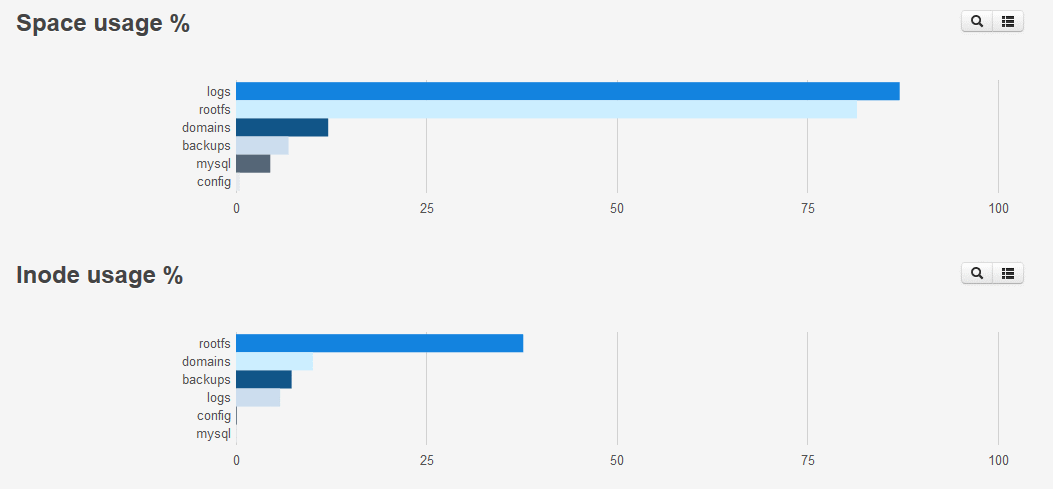
Monit
The disk utilisation graphs on Monit show real-time usage for both space and inodes.
Inodes are the number of files on the disk, where there are limits as to how many files you can possibly have on disk. Its a very high number and usually not a concern unless your store is accidentally using file based storage, not the recommended configuration of Redis
Log Files
Daily logs are generated by the server that provide a report of exactly where space is being consumed. These reports are excellent diagnosis tools to identify where increased disk usage may be originating from.
The reports cover both domains data and MySQL databases/tables.
Don't neglect your security
Security is broad, and a single article isn't going to cover it; although there is an excellent introduction and security checklist for Magento security in our preparing for peak articles that are well worth reading and most importantly, implementing.
As you aren't going to be actively developing or looking at the store; setting up the daily audit logs is a great way to stay informed of any unwanted changes that may occur on your store if compromised.
The audit logs will notify you of any PHP/JS code changes - and give a summary of changed files (if any), allowing you to quickly observe whether everything is still okay without needing to actively be looking through the store or code-base.
Alerting & Monitoring
Finally, you want another set of eyes making sure your store is working. Subscribing to a reputable monitoring service can go a long way to preventing extended downtime.
Sonassi provide a free monitoring and alerting service that you can configure on your account at my.sonassi.com under the "Alerts" menu.
I can't make a personal recommendation, but there are also many 3rd party services that will give you great visibility - I've seen customers happily using products like Uptime Robot, Pingdom, Site Uptime and Monitis.
Sonassi network status
We report any and all outages at status.sonassi.com - and you can be notified whenever we post an update if you subscribe to notifications.
Being aware of global incidents will ensure you get timely updates if there are any issues - and means you won't need to submit a support ticket (as we'll already be aware), freeing up the support team to work on the incident in hand.


